# In Python
try:
  def failing_print(param_a="Am I lazy?", param_b=absolutely_not):
    print(param_a)
except NameError:
  print("Python would not allow me to define this function.")
Python would not allow me to define this function.
Python Shiny celebrates its first year anniversary on PyPi in July 2023. In case that needs further qualification, this is the Python-native implementation of the beloved RShiny dashboarding package that has been available in the R programming framework for over a decade now. Python Shiny has benefited from the experience that the developers at Posit have gained in building its more mature, R-flavoured sibling.
Python Shiny has experienced what I would describe as an accelerated evolution and has the potential to become a front runner in production-grade applications. Mainly because it adheres to an evaluation strategy which is a bit ‘un-pythonic’. Shiny introduces dashboarding with lazy evaluation, meaning that elements of your code will only be evaluated when there is a need to do so. This is not always a great idea, particularly for standard scripting purposes. But it does make event-driven applications more efficient and scalable. More on Posit’s take on the USP of Python Shiny here.
Let’s consider the following example in Python:
# In Python
try:
def failing_print(param_a="Am I lazy?", param_b=absolutely_not):
print(param_a)
except NameError:
print("Python would not allow me to define this function.")Python would not allow me to define this function.Strict (also known as eager) evaluation in Python has triggered an error. I’ve had to catch the error above with the try/except clause in order to render this website. Even though failing_print() never calls on param_b, Python checks that the default value of that parameter exists on definition of the function.
Let us now compare the situation in R.
# In R
passing_print <- function(param_a = "Am I lazy?", param_b = yes_you_are){
  print(param_a)
}
print(paste("Does `yes_you_are` exist? : ", exists("yes_you_are")))
[1] "Does `yes_you_are` exist? : FALSE"passing_print()[1] "Am I lazy?"No exception was raised although the value yes_you_are has not been defined.
Lazy evaluation in Python Shiny minimises the work the application needs to undertake. Values in the app backend will only be re-evaluated as they are needed and contrasts with more pythonic approaches to dashboarding, such as the case with the streamlit package.
This application is written in Python and served with a free shinyapps.io account. I made the app to explore the quality of the spatial data available within OpenStreetMap (OSM) data for certain urban areas. OSM is an open-source, community-maintained source of transport network data. The files also contain other spatial features, such as land use polygons. The quality of this data varies by location, as you may find in the app.
The application is pretty straightforward. It uses pandas to read in some pre-prepared data tables from a data folder. These files were prepared with a python package called pyrosm. Pyrosm is a useful application for ingesting, assessing & visualising OSM data. Selecting a city from the dropdowns then clicking the “Go” button will read the correct table from this little database, then using matplotlib, it visualises the selected spatial features. The app also presents some simple summary statistics in tables at the bottom of the page.
The preparation of the data files is not strictly necessary. You can serve an app and have it make external connections to data services to ingest data. In this instance, I chose to pre-process the data as it helped to improve the performance of the app. Even so, selecting London or Leeds can result in some wait times, so please be aware of this. Options for improving the performance further could include parallel processing, though that is not implemented here and is beyond the scope of this little example.
If you’d like to take a look at the application code and have a GitHub account, you can access it here.
Below is a directory tree diagram of the example Shiny application presented above. It shows the file structure in the various folders.
.
├── 01-update-db.py
├── app.py
├── config
│   └── 01-update-db.toml
├── data
│   ├── leeds-landuse-2023-06-19.arrow
│   ├── leeds-natural-2023-06-19.arrow
│   ├── leeds-net-driving-2023-06-19.arrow
│   ├── london-landuse-2023-06-19.arrow
│   ├── london-natural-2023-06-19.arrow
│   ├── london-net-driving-2023-06-19.arrow
│   ├── marseille-landuse-2023-06-19.arrow
│   ├── marseille-natural-2023-06-19.arrow
│   ├── marseille-net-driving-2023-06-19.arrow
│   ├── newport-landuse-2023-06-19.arrow
│   ├── newport-natural-2023-06-19.arrow
│   └── newport-net-driving-2023-06-19.arrow
├── requirements.txt
└── rsconnect-python
    └── pyrosm-cities-app.json
The Shiny code that generates the application is in app.py. The data folder is where you put any data files you’d like to work with. Here I’m working with the .arrow format (More on that here). However, this folder could be used to store csvs, images, a GeoJSON database, whatever your application needs.
The file 01-update-db.py and the contents of the config folder are related. The python script is used to update the database in the data folder. This part of the workflow can be quite time consuming, particularly extracting the transport network from dense areas such as Greater London. In order to improve the performance of the app, I chose to pre-prepare this data and limit the number of areas to my specific use-case. A previous iteration of this dashboard simply sent requests using the python pyrosm package to get data for any valid area name. The TOML file in the config folder simply stores some parameters used to configure 01-update-db.py, such as named areas of interest, bounding box coordinates in order to crop the maps, that sort of thing. The requirements.txt file is super important. Not only will it help others to re-run your dashboard with the required package dependencies made explicit, this is also a file that hosting services such as shinyapps.io will use to recreate your development environment. More on that later.
Ensuring that you have ‘pinned’ each package version in your requirements file will make publishing to a hosting service such as shinyapps.io a lot easier. It can be frustrating to push your locally working application up to a remote service, waiting for a potentially lengthy deployment routine to complete only to see that your app breaks as you’re working on a different version of numpy than the one available by default in the remote server.
Finally, the rsconnect-python directory is not something that would appear in your Shiny project until you deploy it to a remote-hosting service like shinyapps.io. It contains some metadata about your application which the remote service will use to set up your app properly.
app.py.As stated earlier, this is where your app code goes. But before diving straight into some code, let’s try to get a feel for how the reactivity works.
flowchart TD
  user["User"]
  subgraph Application
  server["Server
  - Executes python code.
  - Processes data.
  - Translates outputs into HTML.
  "]
  ui["User Interface
  - Displays input widgets.
  - Displays rendered server outputs.
  - Can be adjusted with HTML & CSS."]
  db[("Data")]
  end
  user -->|Input Values| ui <-->|Dynamic Values| server
  db -->|Read| server

linkStyle default stroke-width:1px,color:blue;
Each Shiny application comes in two distinct sections. The user interface is the frontend of the application, where a person engages with elements of a web page in order to control visuals, filter tables and so on. The web page translates Python code into HyperText Markup Language (HTML). HTML can be interpreted by a web browser in order to present the user with a structured web page. But in order to present an attractive web page, this HTML foundation needs to be styled. So Cascading Style Sheets (CSS) are used to add decoration to the foundation established by HTML.
Having an attractive web page that does not do something when you click around on it, enter your credit card details or click ‘decline’ on cookie consent notices would be rather pointless. This is where a web developer would use the language of the browser to work with data behind that pretty frontend. That language is JavaScript and it’s remarkably versatile and intimidating to many data-types.
So to make a functioning app, you need to learn 3 distinct languages. For this reason, packages such as Shiny, Dash and Streamlit have become very popular with analysts working within open-source programming frameworks such as Python and R. They allow the creation of applications while adhering to the syntax that an analyst would be more familiar with. Abstracting all that front-end know-how behind some very straightforward Python code allows the analyst to focus their efforts on the parts of their job that they excel in - gaining insight from data.
There would be little value in emulating the excellent Posit documentation on getting started with Python Shiny. To do that, I suggest using their docs. In combination with the examples provided, a comprehensive introduction to Shiny is readily available. In the next section, I will focus on introducing a minimal application and then expanding on some of the more subtle considerations in the reactive flow of the backend. I’ll choose to focus on things where I’ve needed to learn by trial and error, or by searching the Stack Overflow boards through some of the inevitable roadblocks a person encounters when programming dashboards. I’ll throw in some common ‘gotchas’ for good measure.
The fastest way to get up and running with Python Shiny would be to play with the interactive code snippets that Posit makes available on their overview documentation. They host live Shiny sessions with the interactive app and backend code side-by-side. This is a great place to try things out and feel free to copy code from the examples I provide here.
The success of Python Shiny will be down to the adoption & support of the open-source community. This was easier to achieve 10 years ago in the R framework as Shiny had no real competitors at that time. This is not the case in the modern-day Python framework. Even with its particular USP in comparison to Streamlit & Dash, programmers and analysts are creatures of habit. Considering the new player on the block as an alternative to what you already know requires a considerable argument. There will always be overhead in developing familiarity with a new solution’s particular quirks. That said, some of the community-developed packages in the more mature RShiny make building apps at scale very manageable. This final section of this blog takes a look at what Python Shiny bolt-ons we can already play with and a more wistful look over the programming divide at RShiny, considering some of the amazing packages that make me hopeful for the potential future of Python Shiny.
Jupyter Widgets is a well-known add-in for Jupyter Notebooks, allowing for interactive widgets to be displayed and used in Notebooks. This allows for some interesting mini-dashboard opportunities to be served directly within the notebook itself, alongside the code. Having this compatibility from the start is great. While it does introduce a little duplication (Python Shiny has many of its own equivalent ui input widgets), the particular look and range of these widgets will be appealing to many seasoned Python devs. Many of the Jupyter Widget aficionados would have previously developed the capability in specifying callback logic, to be able to capture the user’s interactions with elements of the widget. For example, select a category in a table and use that active selection to filter a chart, the sort of thing that tends to be more prevalent in Business Insight software. Achieving this sort of interaction in Shiny definitely falls under ‘advanced use’. In R, the package crosstalk has significantly lowered the bar in achieving this. Hopefully a dedicated Python Shiny module or package makes its way to PyPi soon.
rsconnect-python.This package is a useful command line interface (CLI) tool that allows you to build application manifests from your Shiny project and deploy them to services such as shinyapps.io. Once you’re ready to share an app with the wider community, check out the docs.
This aspect of Shiny dashboarding is a bit meta. Essentially, when you (or your organisation) gets to a point that they have enough dashboards to be concerned with thinking about consistency and efficiency, take a read through the Python Shiny Modules docs. This is a way of reusing elements of your dashboard, much in the same way in which you reuse code by writing a function. Maybe your organisation has really committed to Shiny and has developed a beautifully-styled interface with house branding, or some interface component such as an Email field with some complex regular expression checking the validity of the Email address. There really is no need to copy-paste that code when you want to use it again. Package the element up as a Shiny Module and you can roll out this feature across multiple dashboards, secure in the knowledge that the quality of this module has already been agreed. Responsibility successfully deferred!
Code reuse is the Holy Grail of Software Engineering — Douglas Crockford
The fact that Python Shiny devs have prioritised modular dashboarding so early is great. It illustrates a commitment to reproducibility that is rightly lauded within the open source community. Just to note that the ability to do this in RShiny took approximately 3 years. Python users are quite spoiled to be able to make use of this feature from the outset.
While I feel generally positive about the future of Python Shiny, I do look across the gulf that exists between the Python and R frameworks with hungry eyes. Particularly at the rich, community-driven plethora of RShiny add-ins that make Shiny the undeniable dashboarding front-runner in that framework. Here is my wish-list of Python Shiny helper tools, ranked order (opinionated warning).
There’s no 2 ways about it, debugging apps is a royal pain. One of my go to helpers in times of need is Posit’s own reactlog package. Reactlog is such an understated tool, yet it has been crucial to me in understanding what’s going on under the hood of my apps. So much so, that I now feel hopelessly exposed when writing apps in Python without it to lean on.
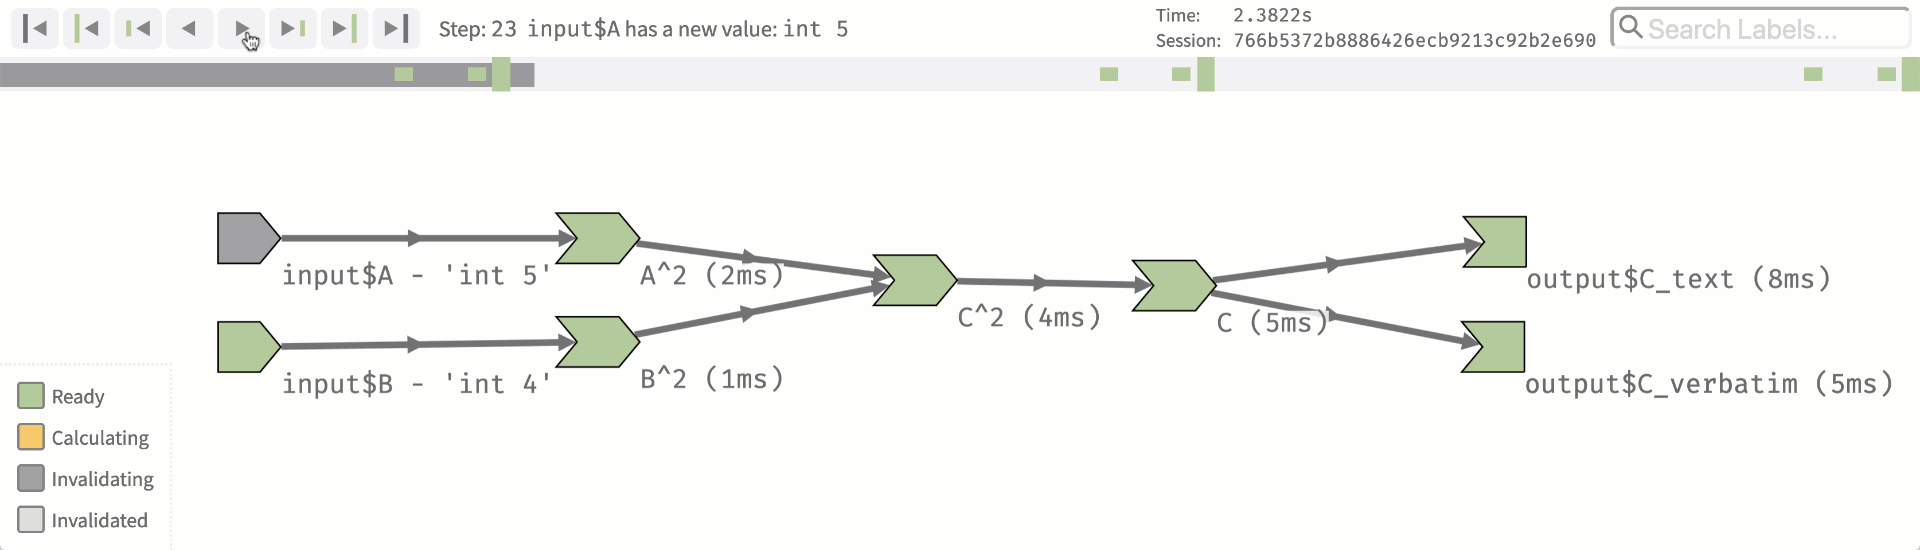
This package allows you to launch an app, showing you useful insights about the performance and reactive flow of your app. It’s an app inception. It can be used in a variety of modes, you can record yourself clicking away on your app and then pause the interface to inspect variable statuses. Reactlog visualises the dependency graph of variables in your server and really is an indispensable debugging tool.
Unit tests for your RShiny app anyone? Authored by the ubiquitous Hadley Wickham, shinytest allows you to make assertions about the behaviour of your application. In combination with the ability to design Shiny modules, this is a key piece of the RShiny toolkit allowing for the design of stable, production-ready Shiny components.
Another one of Posit’s own packages, DT helps to create beautiful, customisable and interactive data tables for the presentation of tables. Not just for RShiny applications, DT is also widely used in Rmarkdown reports. A dedicated Python Shiny solution would be most welcome.
The shinyhelper package developed by Chris Mason-Thom is an excellent solution for those involved applications that need a little more guidance for the user.
Shinyhelper allows the developer to include markdown files with extensive instructions, images and gif animations of how to use your application. These documents will be hidden from the screen until the user chooses to click on the help icons that shinyhelper provides. These help icons can be easily styled and positioned around any element within your ui. Once clicked, they will launch modal windows with your beautifully formatted instructions, allowing a wealth of guidance to be included within your app without causing excessive clutter.
Try clicking through the different helper symbols in the demo RShiny application below.
Python Shiny is a promising addition to the Python programming framework. It has a USP, and Posit have the know-how to apply the learning from their past development of RShiny to help ensure it has a bright future. It is also worth noting that Posit have recently put a lot of effort into developing Quarto, which you may think of as like Rmarkdown but with native Python, R and Julia support. The reason why this is important is that often, interactive widgets and solutions designed for use in notebooks or markdown documents take little refactoring to get them running in Shiny apps. Or conversely, there are ways to convert rmarkdown docs into Shiny or Shiny-like applications. Understanding the synergies between these tools and how they have influenced the evolution of RShiny may give some insight into how we may expect Python Shiny & Quarto to develop in the years ahead.
The Python community is well-served by dashboarding solutions which will affect its wider adoption. If you are newer to dashboarding, or if you are looking for a solution that perhaps scales better than some of the other options available in the Python framework, then consider Python Shiny. It’s already pretty great and will only get better as the community warms to this new tool in the Python toolkit.